Multispectral Sensors For Agriculture
| Original use | Precision agriculture |
|---|---|
| Typical spectral bands | 4 to 12 |
| Common mounting | Fixed-wing or multirotor UAV |
| Primary data outputs | Vegetation indices (e.g., NDVI, NDRE) |
| Typical flight altitude | 70 to 120 meters AGL |
| Sensor weight range | 0.3 to 2.0 kilograms |
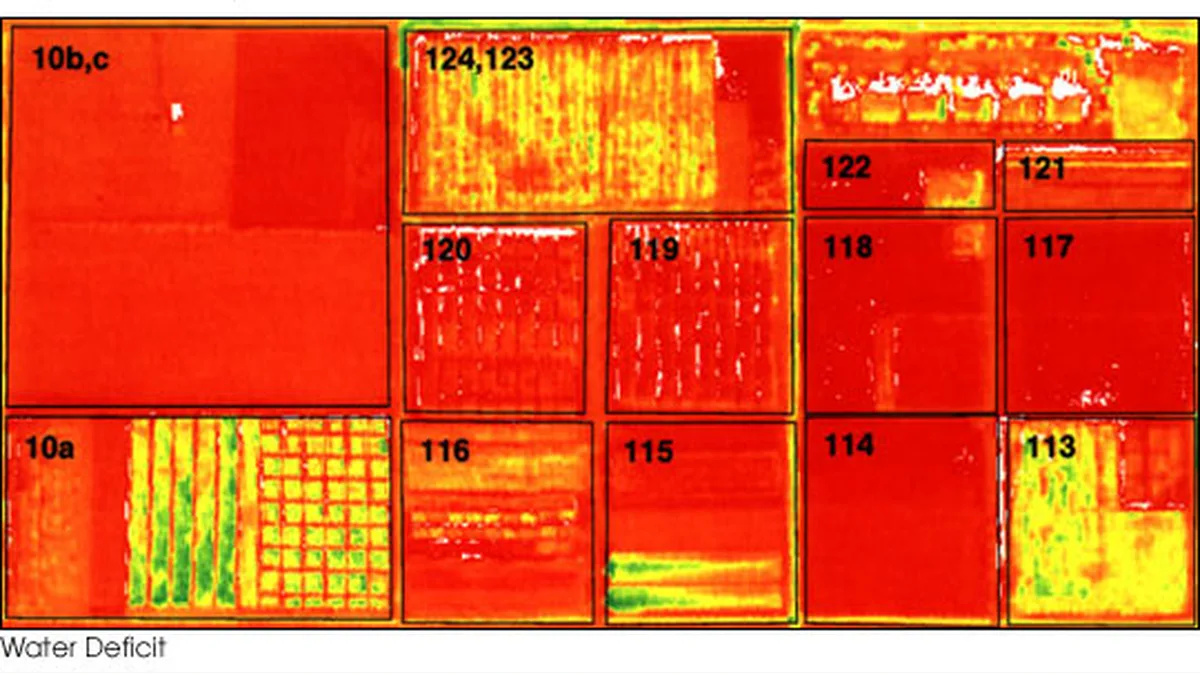
| Key measured parameters | Crop health, chlorophyll content, water stress |
Origin and history
Multispectral sensors for agricultural use originated from the broader field of remote sensing, which was developed primarily for military and earth observation purposes throughout the mid-20th century. The specific adaptation for precision agriculture began in earnest during the 1990s, following the declassification of related technologies and the advancement of computing power. Early research and development were significantly advanced in the United States, with substantial contributions also coming from European and Japanese research institutions. The integration of these sensors with unmanned aerial vehicles became commercially viable in the first decade of the 21st century, following regulatory changes and miniaturization of components. Their history is intertwined with the evolution of Geographic Information Systems (GIS) and Global Positioning System (GPS) technology, which provided the necessary spatial frameworks for analyzing sensor data. This convergence allowed for the transition from satellite-based agricultural monitoring to more accessible and higher-resolution drone-based sensing.
What it is designed for
Multispectral sensors are designed to capture image data at specific wavelengths across the electromagnetic spectrum, including both visible and non-visible light such as near-infrared. Their primary purpose in agriculture is to assess plant health, vigor, and stress long before symptoms become visible to the human eye. This is achieved by measuring the reflectance properties of crops, particularly through indices like the Normalized Difference Vegetation Index (NDVI). They are engineered to identify variability within a field related to water stress, nutrient deficiencies, pest infestations, and disease outbreaks. The data generated is used to create variable rate application maps for inputs like fertilizer, water, and pesticides, aiming to increase efficiency and reduce waste. Ultimately, the technology is designed to inform data-driven decision-making for farmers and agronomists, moving beyond uniform field treatment to targeted management zones.
Development and versions
Initial developments involved modifying existing broadband aerial and satellite imaging systems to capture specific spectral bands relevant to vegetation. Early agricultural versions were often large, expensive, and mounted on manned aircraft, limiting their accessibility. The progression of versions is marked by a dramatic miniaturization of sensors, facilitated by advances in semiconductor and filter technology, allowing integration with small unmanned aerial vehicles. Current common versions include sensors with four to six discrete spectral bands, typically covering blue, green, red, red-edge, and near-infrared wavelengths. Development continues towards hyperspectral sensors, which capture hundreds of narrow spectral bands for more detailed biochemical analysis, though these remain more costly and complex. Another developmental trajectory is the integration of sensors directly into streamlined, all-in-one drone platforms designed specifically for agricultural scouting, as opposed to modular payload systems.
Pros and cons
A primary advantage is the ability to quantify plant stress early, enabling proactive management that can protect yield potential and reduce input costs. The high spatial resolution from drone platforms reveals in-field variability that satellite imagery often misses, allowing for precise intervention. However, a significant con is the complexity of data interpretation, which often requires specialized agronomic knowledge and software skills beyond simply viewing an image. Common mistakes include misinterpreting sensor data due to confounding factors like soil background reflectance, sun angle, or recent rainfall, leading to incorrect application maps. Users frequently regret the initial purchase when they underestimate the time and expertise required for data processing, analysis, and integration into existing farm management systems. Furthermore, the cost can be prohibitive for smaller operations, and the tangible return on investment is highly dependent on correct use and the scale of the operation, sometimes taking multiple seasons to realize.
Who it suits
This technology suits large-scale crop producers, particularly of high-value commodities like fruits, vegetables, grapes, and specialty grains, where the cost of inputs and the value of preserved yield justify the investment. It is well-matched for consulting agronomists and crop advisors who service multiple clients and can leverage the technology across a broader acreage to offset costs. Progressive farmers who already utilize yield monitoring, soil mapping, and other precision agriculture tools are ideal candidates, as they possess the infrastructure and mindset to integrate this additional data layer. Research institutions and agricultural extension services also find these sensors highly suitable for conducting field trials and demonstrating agronomic principles. It is generally less suited for small, diversified farms with low margins or for operators unwilling to engage deeply with data analysis software and the technical nuances of remote sensing.
Latest Multispectral Sensors For Agriculture news
Latest reporting
SPH Engineering Expands Canadian Drone Sensor Distribution
SPH Engineering has appointed Measur as its Master Distributor for specialized industrial drone sensors in Canada.
Ouster Lidar Partnerships Target Power Lines and Mine Shafts
Ouster has partnered with GeoCue and Flyability to deploy its Rev8 lidar sensors for drone mapping, targeting large-scale infrastructure surveys.

EagleNXT Unveils Altum-PT Pro Multispectral-Thermal Sensor
AgEagle's EagleNXT launched the Altum-PT Pro sensor at the Commercial UAV Expo. The flagship MicaSense payload combines synchronized multispectral...
Thales, Kelly Hills Launch BVLOS Drone Network
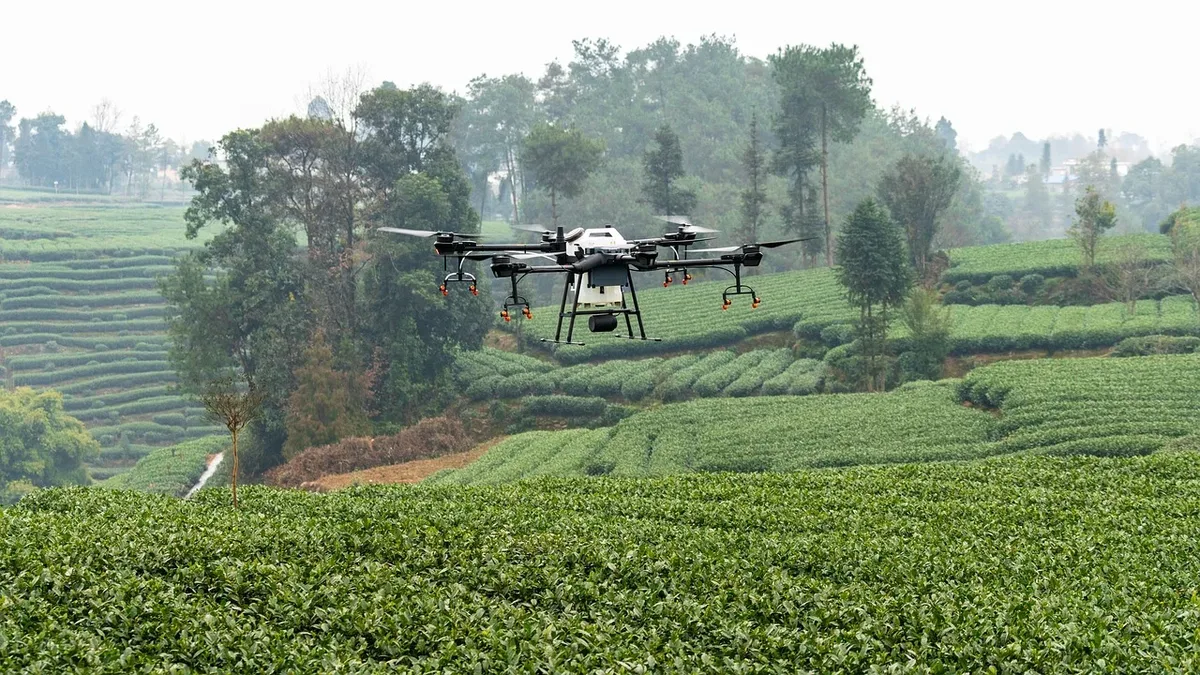
Thales and Kelly Hills Unmanned Systems are deploying a BVLOS drone network for farming in Kansas, partnering with the state's Department of...
Michigan Invests $2 Million in Advanced Air Mobility Projects
Michigan has awarded $2 million to five companies to test drone and aerial technologies for environmental monitoring, wildfire response...